Social Media Hub
To view this content, javascript must be enabled in your browser.
NESDIS Social Media »
-
Vislab YouTube Feed
Extended Drought Conditions in the United States
 By early July 2012, more than 60% of the contiguous United States was experiencing drought conditions, nearly double the area from early January. This animation shows monthly composites of D1 to D4 categories of drought in the contiguous U.S. over the time frame January 2012 to July 2012 using data from the U.S. Drought Monitor. The Drought Monitor summary map identifies general drought areas, labeling droughts by intensity, with D1 (lightest color) being the least intense and D4 (darkest color) being the most intense.
Drought and Vegetation Health
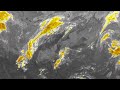
 The United States is experiencing one of the worst droughts since the 1950's. Hot temperatures and low precipitation have created a visible impact across the nation: stressed and dying vegetation. NOAA's satellites are used to measure the impact of drought on vegetation, and in many ways, the ability to measure the impact on vegetation provides a more readily understandable way to measure drought. This animation shows monthly composites of vegetation health index derived from data from the AVHRR sensor on-board the NOAA POES satellite. Areas colored in shades of orange are experiencing moderate through exceptional drought conditions and are consistent with areas of vegetation stress.
Historic Storm Strikes U.S. East Coast
 A week-long heat wave and an upper level disturbance over Chicago combined to spawn an historic storm featuring a rare and destructive phenomenon known as a derecho. A derecho is a widespread, long-lived wind storm that is associated with a band of rapidly moving showers or thunderstorms. Although a derecho can produce destruction similar to that of tornadoes, the damage typically is directed in one direction along a relatively straight swath. As a result, the term "straight-line wind damage" sometimes is used to describe derecho damage. By definition, if the wind damage swath extends more than 240 miles (about 400 kilometers) and includes wind gusts of at least 58 mph (93 km/h) or greater along most of its length, then the event may be classified as a derecho. This movie shows imagery from the GOES East satellite starting at 0015Z on June 29, 2012 and ending 2345Z on June 30, 2012.
NOAA Model Shows Wildfire Smoke Dispersion
 When volcanoes erupt, toxic plumes are released, or wildfires burn, NOAA's HYSPLIT model is used to answer some fundamental questions: where will it go and how concentrated will it be? The HYSPLIT wild fire smoke model run on June 29th, 2012 at 6z shows the cloud of smoke being emitted from many of the wildfires raging in the Western U.S. The actual locations of these point-source pollutants can be seen as very high concentration smoke areas. The ability of the GOES satellite todetect aerosols is an important input to these models, as are the wind measurements derived from GOES infrared imagery.
HYSPLIT Model: www.arl.noaa.gov/HYSPLIT_wildfire.php
NOAA air quality website: airquality.weather.gov
When volcanoes erupt, toxic plumes are released, or wildfires burn, NOAA's HYSPLIT model is used to answer some fundamental questions: where will it go and how concentrated will it be? The HYSPLIT wild fire smoke model run on June 29th, 2012 at 6z shows the cloud of smoke being emitted from many of the wildfires raging in the Western U.S. The actual locations of these point-source pollutants can be seen as very high concentration smoke areas. The ability of the GOES satellite todetect aerosols is an important input to these models, as are the wind measurements derived from GOES infrared imagery.
HYSPLIT Model: www.arl.noaa.gov/HYSPLIT_wildfire.php
NOAA air quality website: airquality.weather.govNOAA Satellite Captures Venus Transit
 The NOAA GOES satellites are most commonly associated with the non-stop coverage of severe weather over the western hemisphere. However, one of the sensors on-board the GOES spacecraft, the Solar X-Ray Imager (SXI), points towards the Sun, providing constant monitoring of space weather, especially solar flares. On June 5th, the GOES-15 SXI captured the transit of Venus across the Sun. It can be seen in this animation as a small dark spot that crosses from left to right. The next transit of Venus visible by Earth will occur in 2117.
Hurricane Andrew 1992
 Hurricane Andrew was only the third Category 5 storm to impact the U.S. when it made landfall on August 24, 1992 near Homestead, FL. A reanalysis of weather data in 2004 revealed that the storm made landfall with 166 mph winds. Until Hurricane Katrina followed in 2005, Andrew was the most costly U.S. tropical cyclone in history, with damages exceeding $26.5 billion (1992 USD). This animation was created by resurrecting archived GOES-7 satellite data.
Few 20th Century April Heat Records Remain
 After a decade of warmer than average Aprils in the U.S., few highest monthly maximum temperature records for April remain from the 20th Century. This image plots the decade in which the highest average April temperature record was set for different regions of the country, starting in 1911 (i.e., 1911-1920) and running through 2010, using data from the NOAA National Climatic Center's detailed archives. The records broken in 2011 and 2012 are shown separately. Most of the pixel colors are associated with the 2001-2010, 2011 and 2012 time periods. Gray indicates no data (records) are associated with that area of the country.
The Halloween Storm, Also Known as "The Perfect Storm" - 1991
 The conditions were "perfect" for a monstrous storm, a meteorological time bomb that would explode in the northern Atlantic Ocean creating waves ten stories high and imperiling the New England fleet.Bob Case, a NOAA National Weather Service meteorologist at the Boston, MA forecast office: "It was an unprecedented set of circumstances. A strong disturbance associated with a cold front moved along the U.S.- Canadian border on October 27 and passed through New England pretty much without incident. At the same time, a huge high pressure system was forecast to build over southeast Canada. When a low pressure system along the front moved into the Maritimes southeast of Nova Scotia, it began to intensify due to the cold dry air introduced from the north. These circumstances alone, could have created a strong storm. But then, like throwing gasoline on a fire, a dying hurricane Grace delivered immeasurable tropical energy to create the perfect storm."
The imagery in the movie was taken by GOES-7 between 0500Z on October 28, 1991 and 2330Z November 4, 1991. On April 12, 2012 GOES-7 was retired from service through a final burn from its booster, which moved it approximately 186 miles (300 km) above its operational geostationary orbit to a graveyard orbit, so that it will not interfere with other satellites. The final maneuver to adjust the spin rate of the spacecraft and deplete all remaining fuel happened at 2 a.m. EDT April 12, 2012. The communications packages were turned off then and the satellite powered down. GOES-7 is the only satellite in the history of NOAA's geostationary program to serve both as the GOES-East and GOES-West spacecraft in the course of normal operations.
The conditions were "perfect" for a monstrous storm, a meteorological time bomb that would explode in the northern Atlantic Ocean creating waves ten stories high and imperiling the New England fleet.Bob Case, a NOAA National Weather Service meteorologist at the Boston, MA forecast office: "It was an unprecedented set of circumstances. A strong disturbance associated with a cold front moved along the U.S.- Canadian border on October 27 and passed through New England pretty much without incident. At the same time, a huge high pressure system was forecast to build over southeast Canada. When a low pressure system along the front moved into the Maritimes southeast of Nova Scotia, it began to intensify due to the cold dry air introduced from the north. These circumstances alone, could have created a strong storm. But then, like throwing gasoline on a fire, a dying hurricane Grace delivered immeasurable tropical energy to create the perfect storm."
The imagery in the movie was taken by GOES-7 between 0500Z on October 28, 1991 and 2330Z November 4, 1991. On April 12, 2012 GOES-7 was retired from service through a final burn from its booster, which moved it approximately 186 miles (300 km) above its operational geostationary orbit to a graveyard orbit, so that it will not interfere with other satellites. The final maneuver to adjust the spin rate of the spacecraft and deplete all remaining fuel happened at 2 a.m. EDT April 12, 2012. The communications packages were turned off then and the satellite powered down. GOES-7 is the only satellite in the history of NOAA's geostationary program to serve both as the GOES-East and GOES-West spacecraft in the course of normal operations.Animation of April 2012 Nor'easter Storm
 A Nor'easter storm is bringing heavy rains and snow to many parts of the Northeast U.S. The system developed as a large front moved across the U.S. on Friday, combining with a smaller convective system off the coast of Florida. As this system moved north, it intensified and drew in cold air from the Great Lakes region. Lake --effect snows of up to 12-18 inches have fallen in the higher elevations of West Virginia through New York. Winter storm warnings have been issued by the National Weather Service for these areas. This time-lapse animation uses infrared imagery from the NOAA GOES-13 satellite to track the storms' movement from April 20-23, 2012. Nor'easters are most commonly associated with winter storms, but can occur at any time of the year.
Over 15,000 Records Broken as March 2012 Becomes Warmest on Record
 According to NOAA scientists at the National Climatic Data Center (http://www.ncdc.noaa.gov/sotc/), record and near-record breaking temperatures dominated the eastern two-thirds of the nation and contributed to the warmest March on record for the contiguous United States, a record that dates back to 1895. This animation shows the locations of each of the 7,755 daytime and 7,517 nighttime records (or tied records) in sequence over the 31 days in March.
-
NESDIS News Feed
Down to the Deep: NOAA's Serious Mapping Mission Makes for Fascinating Exploration
If Hollywood director James Cameron reaches the bottom of the Mariana Trench-6.8 miles (10,900 meters) below the waves-this month, he will get a look at the deepest known spot on the ocean floor.Mar22, 2012 00:00:00 -0500
NPP to JPSS Transition Complete
NOAA’s Joint Polar Satellite System (JPSS) has taken over operations of the Suomi National Polar-orbiting Partnership (NPP) now that all five of the satellite’s instruments are activated and routinely collecting scientific data.Mar06, 2012 00:00:00 -0500
VIIRS captures massive Dust Cloud over Texas
Wind gusts upwards of 70 miles per hour pushed a 6,000 foot high dust cloud through Lubbock, Texas on February 20. From its orbit 500 miles above Earth's surface, the Suomi-National Polar Partnership (NPP) satellite's Visible Infrared Imaging Radiometer Suite (VIIRS) captured this image...Mar01, 2012 00:00:00 -0500
Message from Assistant Administrator Mary Kicza on the President's 2013 Budget
The President submitted his FY 2013 budget request to the Congress on February 13. I want to provide you with the details of the National Environmental Satellite, Data, and Information Service (NESDIS) portion of the budget as well as context for the decisions that were made as this budget was developed.Feb21, 2012 00:00:00 -0500
NPP Resumes Mission Checkout Phase
NPP Resumes Mission Checkout PhaseJan19, 2012 00:00:00 -0500
GOES Transitions from 11 to 15
New technology brings higher resolution imagery and more exacting scienceDec 5, 2011 00:00:00 -0500
Why Change Satellites?
An FAQ about the GOES -11 to Goes-15 transitionDec5, 2011 00:00:00 -0500
NPP Satellite Acquires First VIIRS Image
The Visible Infrared Imager Radiometer Suite (VIIRS) onboard NASA's newest Earth-observing satellite, NPP, acquired its first measurements on Nov. 21, 2011Nov21, 2011 00:00:00 -0500
NPP Successfully Launched
America's newest polar-orbiting satellite roared into orbit this morning, setting the stage for enhanced weather data NOAA scientists will use to develop life-saving severe weather forecasts days in advance.Oct28, 2011 05:028:00 -0500
National Ice Center Gears Up for Winter Ice Rescues
With fall and winter's colder temperatures approaching, the U.S. Coast Guard's Ninth District will soon be using satellite data from the National Ice Center (NIC) to aid in rescue missions involving anyone missing or in potentially life-threatening situations on the ice in the Great Lakes area.Thu, 22 Sep 2011 00:00:00 -0500
Using some basic open-source technologies like jQuery, XML, XSLT, Wget, JSON, and RSS along with Social Media Networks' APIs, I created this custom Social Media Hub. Although there are numerous plugins and code-examples for Social Media feeds, I could not find one that elegently renders feeds exactly the way we wanted, so I created my own.
j.john.carroll@gmail.com